SALES & COLLECTION ANALYSIS
- 1. INTRODUCTION
- 2. FILTER
- 3. PIE CHART SALES ANALYSIS
- 4. RESET BUTTON
INTRODUCTION
Sales analysis is where the user can view and analyze the sales of the company. User may filter the sales data according to specific date, debtor and also the salesman. The information will be displayed in pie chart to make it easier for user to do the analysis and compare the sales accordingly. The details of the chart will be provided with the percentage, number of transaction and the amount of sales.
2. FILTER
• Date
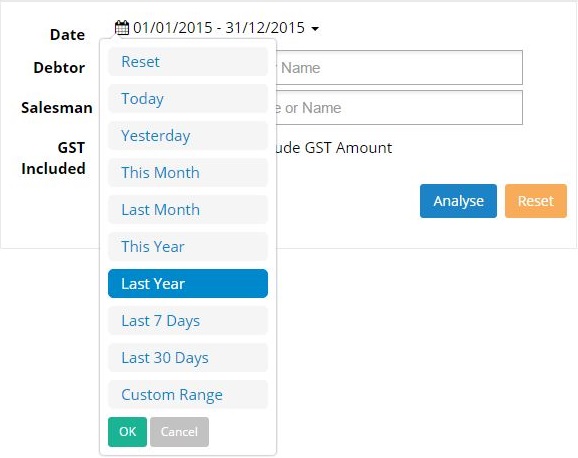
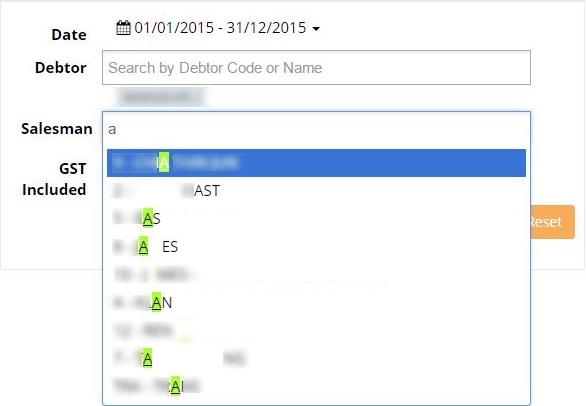
User may filter the sales record by selecting the required date as follow.
• Debtor
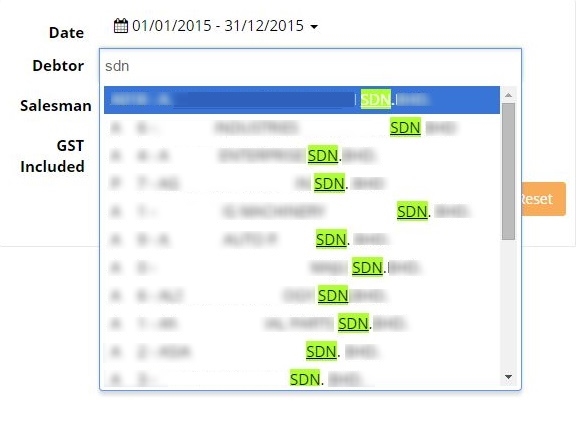
User may key in 3 characters to search for specific debtor/company. User can view the sales record for the selected debtor. Click analyse to view the sales record in the form of pie chart.
• Salesman
Displays the sales record according to the selected salesman. User may key in 3 characters to search for specific salesman. Click analyse to view the sales record in the form of pie chart.
• GST Included
User may select to include or exclude the GST amount in the sales record. Ticking the box will include the GST amount in the total sales.

3. LINE CHART
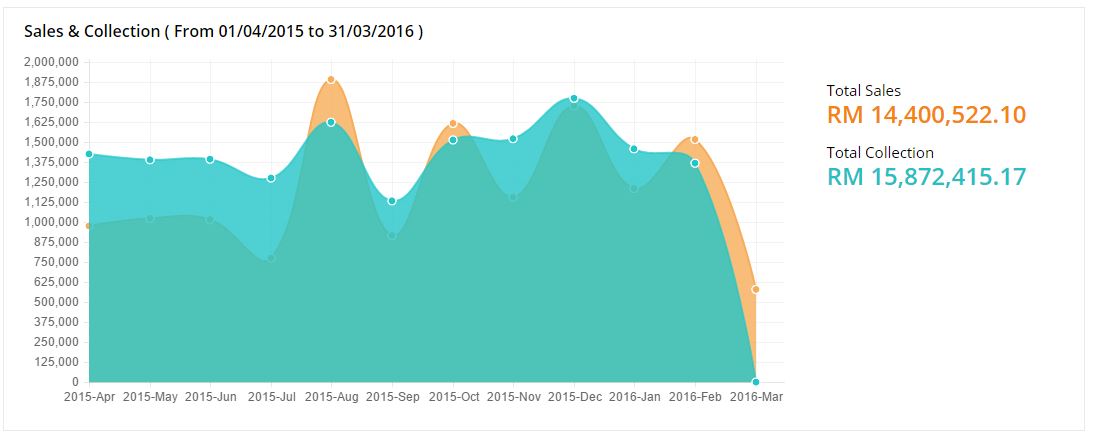
After filtering according to user’s preferences, then user can view the data for the selected period in the form of line chart. The line chart will show different points at different period of the total sales and total collection. The green area represents the total collection and the yellow area represents the total sales. The line across the points will create a slope to show whether the sales and collection performance increase or decrease. Line chart will make it easier for user to make a quick and efficient analysis on the sales and collection performance.
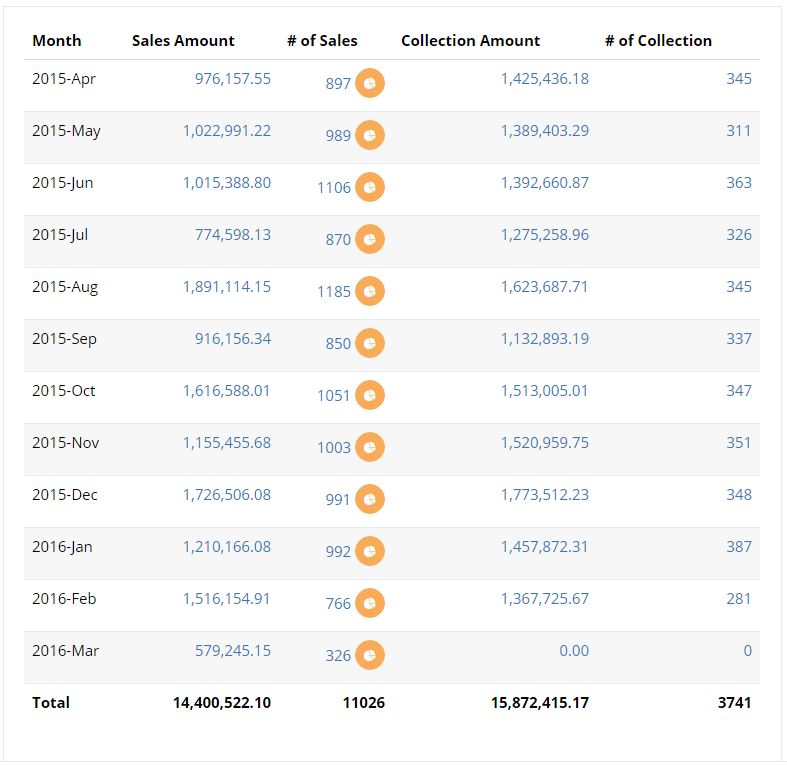
The line chart will come along with the brief details for each month sales amount, number of sales, collection amount and number of collection. At the bottom, user can view the total amount for sales, the total number of sales, the total amount collection and the number of collection. User can click to drill down each of the information to details:
• Clicking on Sales amount, # of sales, collection amount and # of collection will like user to the document list as follows:
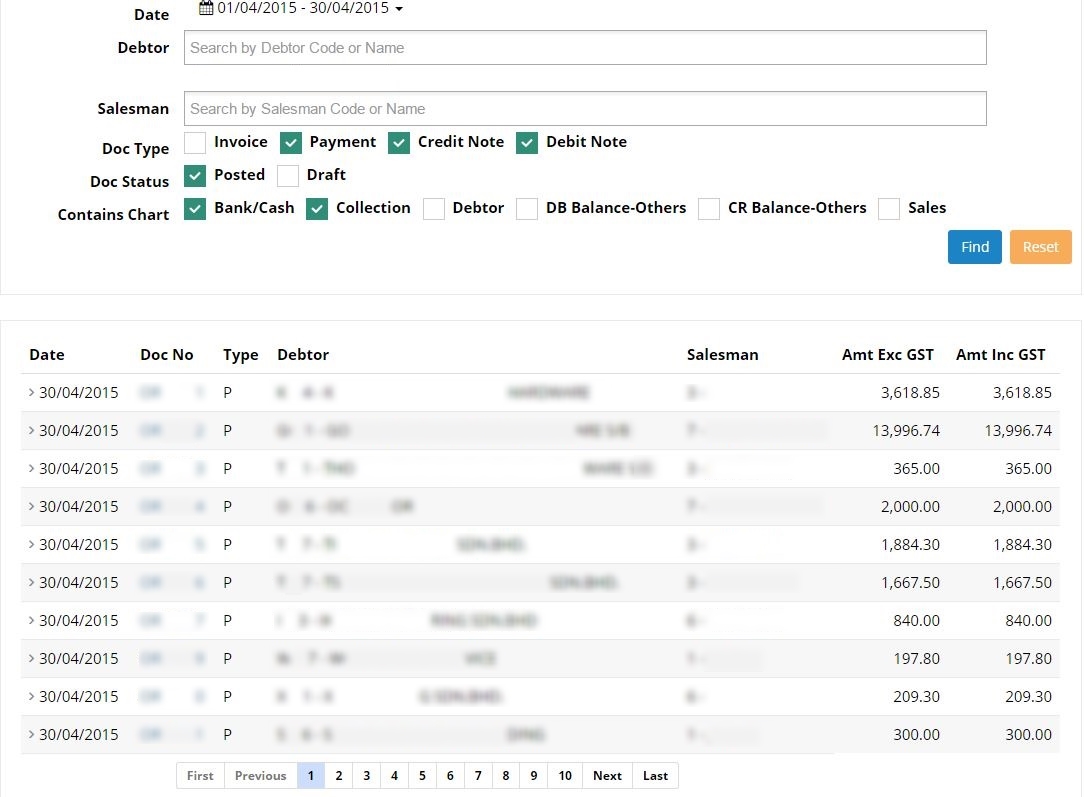 (Further explanation on this screen are described in ‘Document List’ section)
3. RESET SEARCH
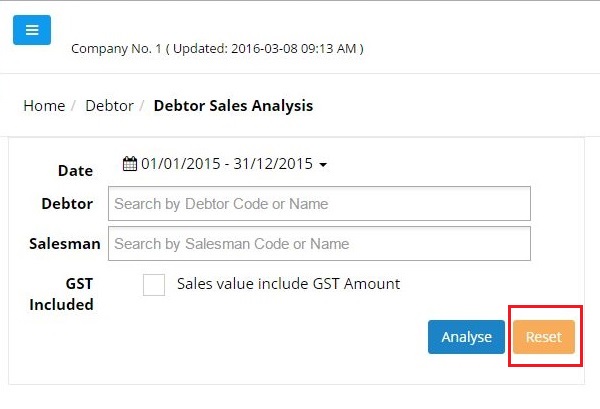
User may click on ‘Reset’ button to reset the search from the previous filtering.