SALES COLLECTION ANALYSIS
- 1. INTRODUCTION
- 2. SEARCH FILTER
- 3. RESULT
INTRODUCTION
Sales Collection analysis is purposely built to ease user in analyzing and tracking the sales collection record. The data will be presented in pie chart diagram which is easy for user to see and compare the sales collection performance.
1. SEARCH FILTER
• Salesman
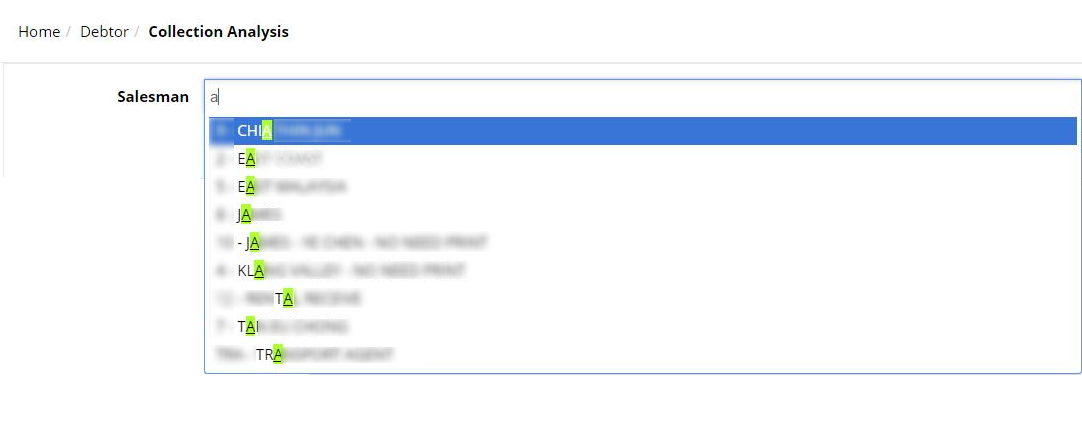
Displays the sales record according to the selected salesman. User may key in 3 characters to search for specific salesman. Click analyse to view the sales record in the form of pie chart.
2. RESULT
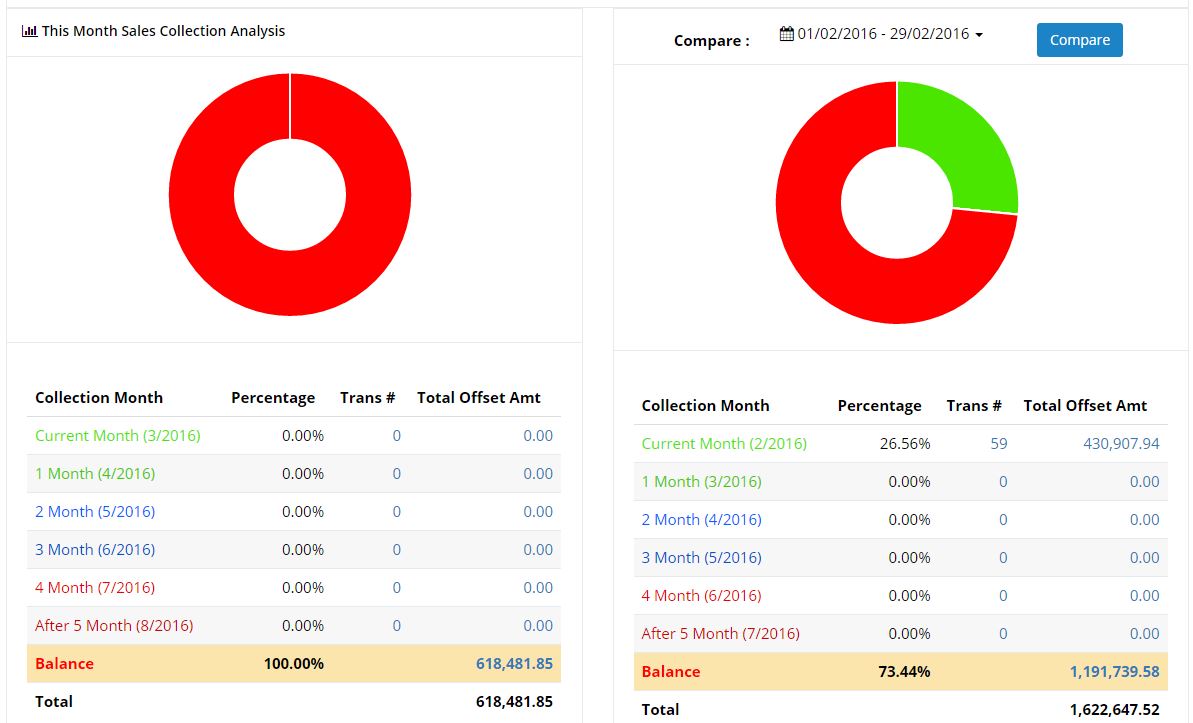
The result will be displayed in pie chart form. There are two pie charts for a quick comparison between current sales collection and any selected period sales collection. Left side shows the current month Sales Collection Analysis, and the left side show any selected period Sales Collection.
The red area indicates the remaining balance of the sales that has not been collected, while the green area indicates the sales that has been collected.
The information below the pie chart diagram is the quick information on the pie chart. User can see the details of the collection month complete with the percentage number of transactions and total offset amount. At the bottom, the result will show the total offset amount.
User can click on the figure for number of transactions and total offset amount to view the information in details.
Clicking on the number of transactions will directly link user to the Debtor Sales Collection Analysis Details:
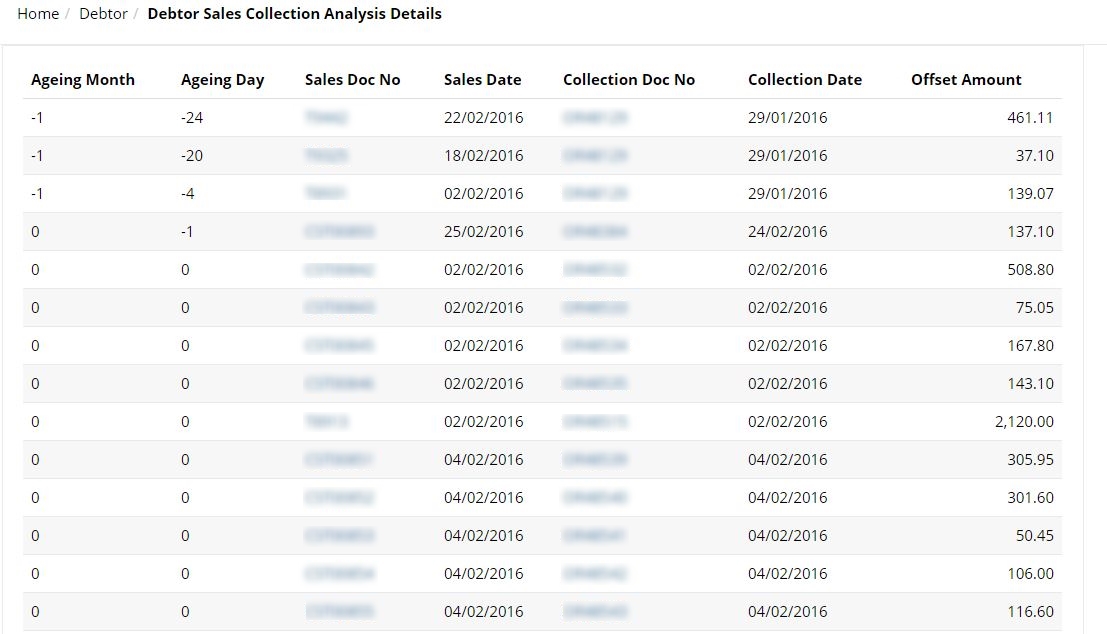
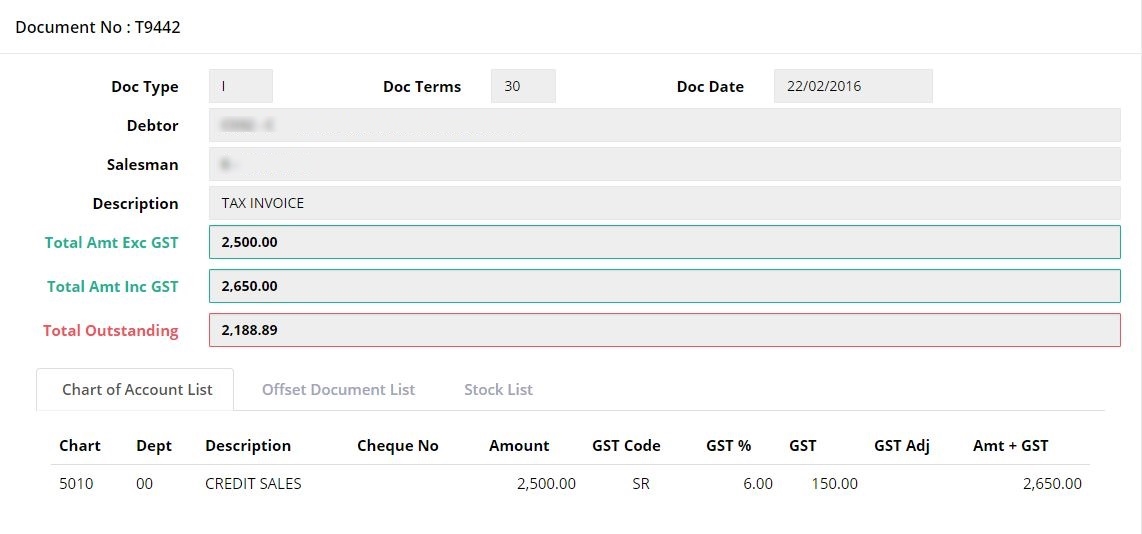
User can click on the Sales Doc No to view the details of the document.
 (Further explanation on this screen are described in ‘Document List’ section)
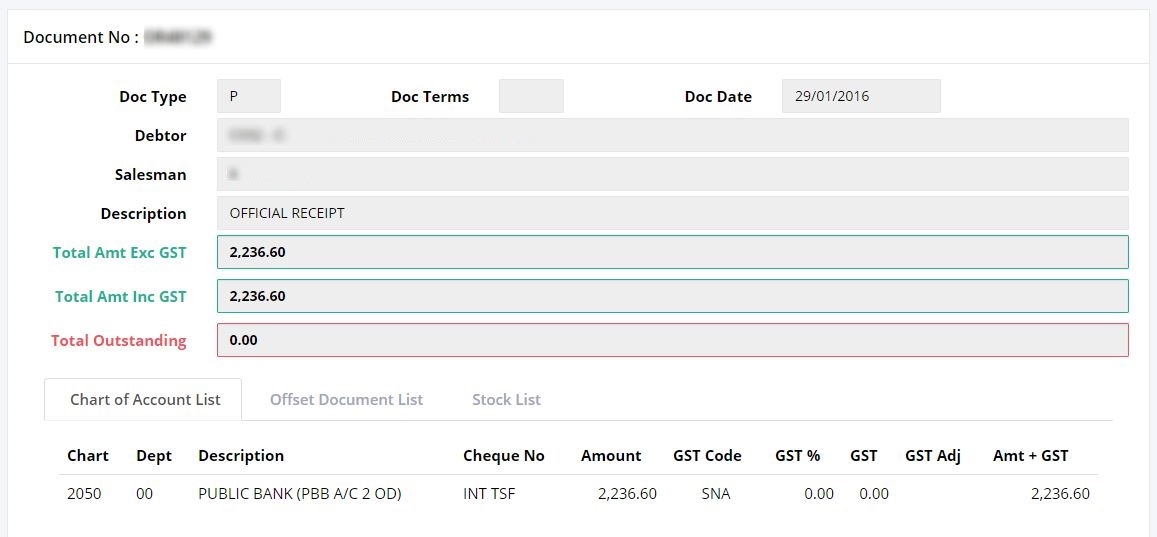
User can click on the Collection Doc No to view the details of the document.
 (Further explanation on this screen are described in ‘Document List’ section)