DEBTOR LEDGER
- 1. INTRODUCTION
- 2. SEARCH FILTER
- 3. RESULT
- 4. PIE CHART
INTRODUCTION
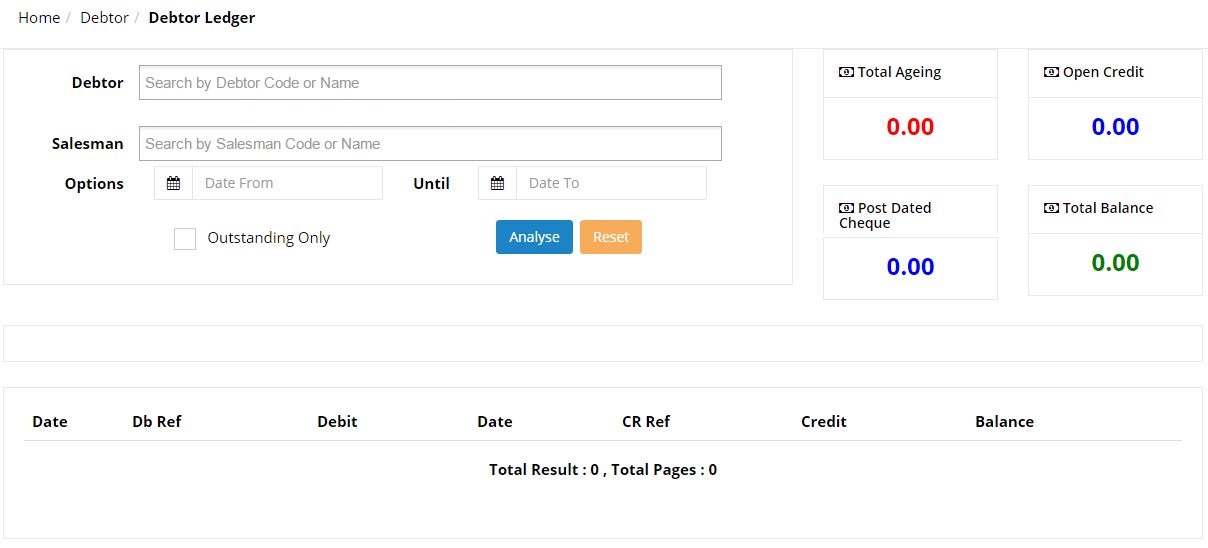
Debtor Ledger is where the user can get the information from the sales journal. The purpose of the Debtors Ledger is to provide knowledge about which customers owe money to the business, and how much. Basically all the information can be clicked to drill down and lead user to the more details screen. The screen is a quick and easy way to display the debtor information for the user. User may select any required information to find the specific information on the ageing records.
1.FILTER
• Debtor
User may key in 3 characters to search for specific debtor/company. User can view the sales record for the selected debtor.
• Salesman
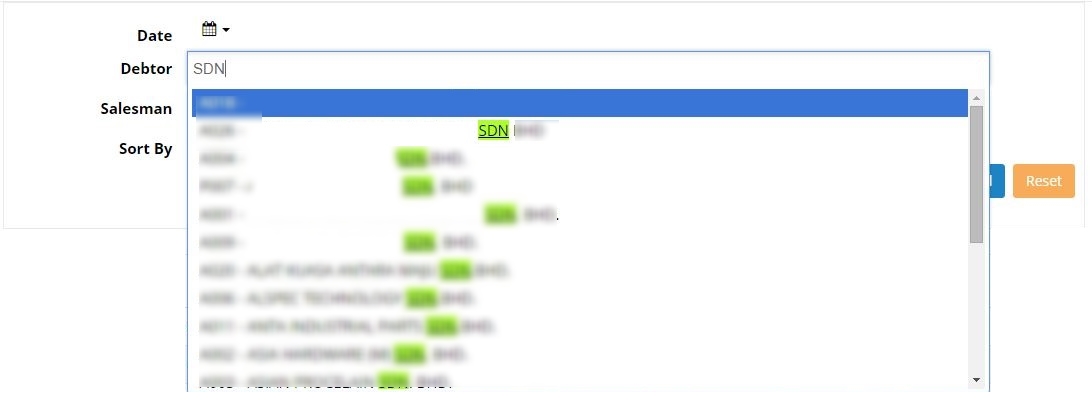
Displays the sales record according to the selected salesman. User may key in 3 characters to search for specific salesman.
• Date
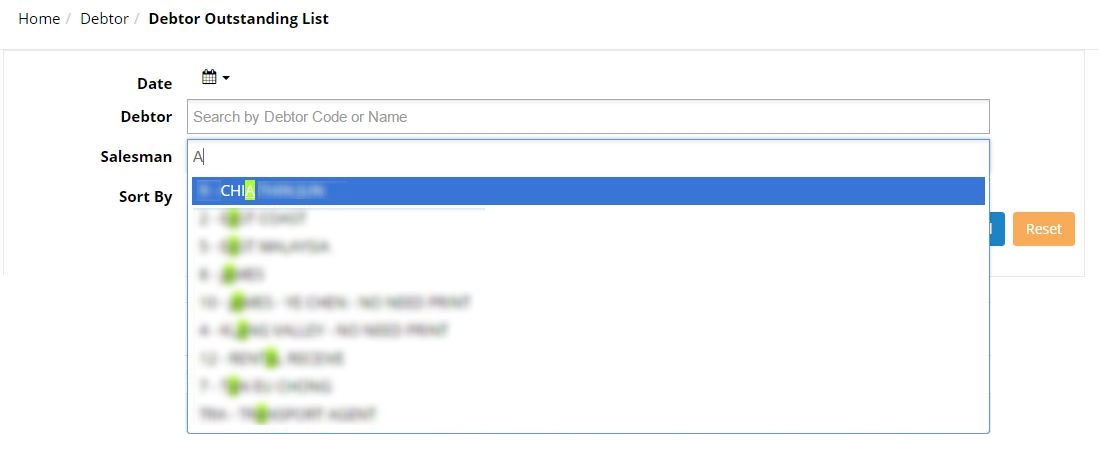
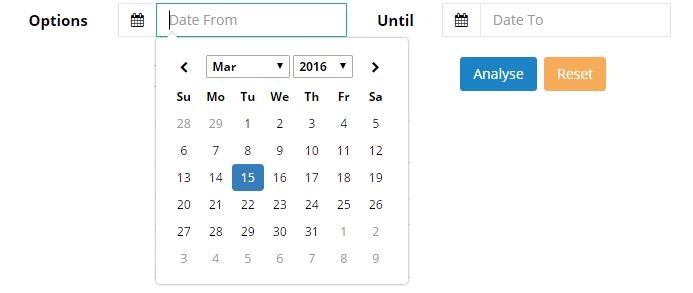
User may filter the sales record by selecting the required date as follow. User can click on analyse button to view the result:
3. RESULT
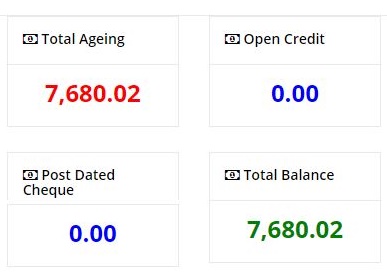
The screen displays the total ageing, open credit, Post Dated Cheque and Total Balance. Total ageing shows the total of how much the debtor still owe you. Open credit shows the total of payment that has not been applied to any transactions. The postdated cheque shows the total of payment by cheque that has not been applied to any transaction and total balance is how much the remaining balance the debtor need to pay.

This part shows the amount of remaining balance by month. User can view how much the total amount the debtor owe by month and user can click on the image to drill down to more details part.
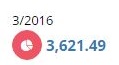
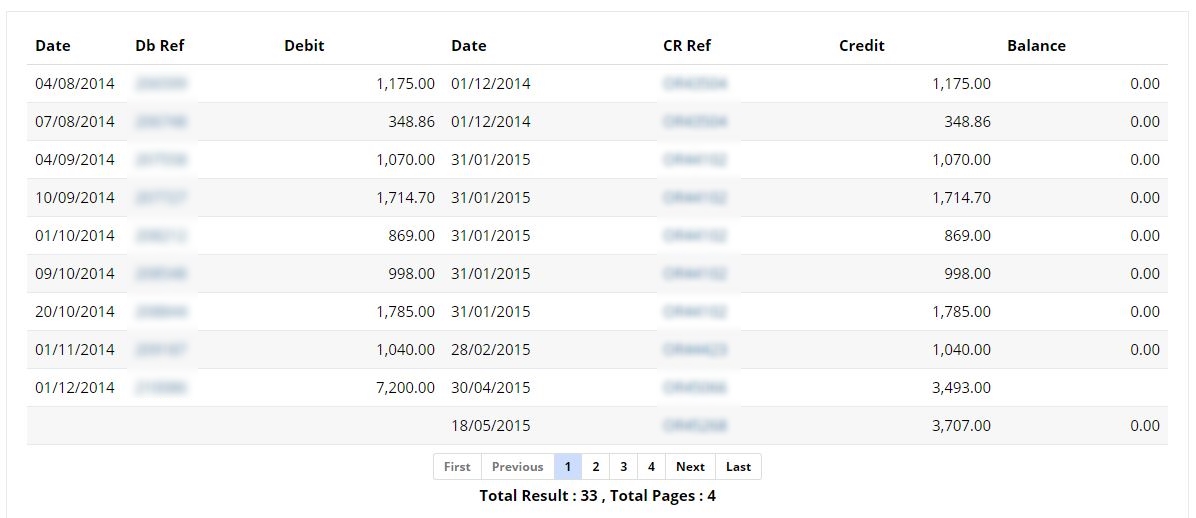
User can click both on the image and number. Clicking on the red image will lead to the next screen:
4. PIE CHART
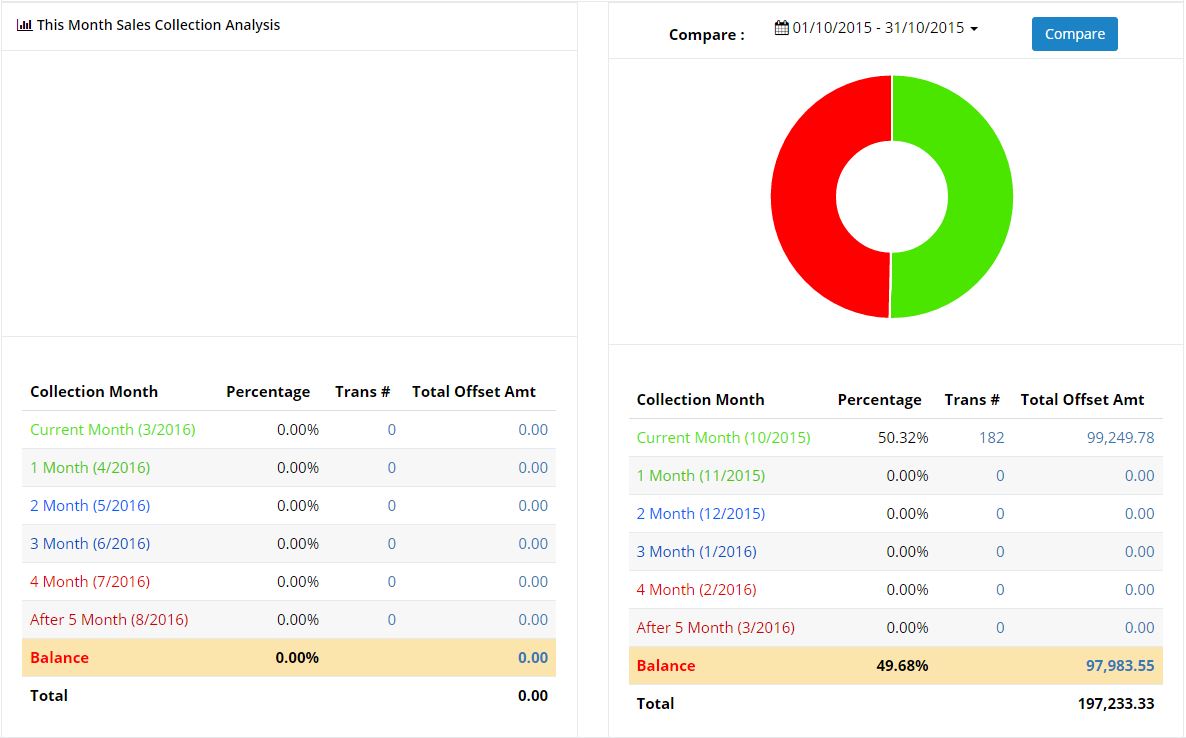
The screen shows the pie chart of total sales collection (the payment that has been collected from the debtor). On the left side shows the total sales collection for the current month and at the right shows the total sales collection for the selected month. The details including the collection month, percentage, the number of transactions and the total offset amount.
The pie chart shows the green area is the total payment collected and it can be view in the list that the percentage for current month collection is 50.32% with the total of 182 transaction and the total offset amount of RM99, 249.78.
The red area on the pie chart indicates the remaining balance that the debtor has to pay, based on the list below user can view the percentage for the balance is 49.68% with the total amount of RM97, 983.55.
User can also view the total sales and collection are RM 197, 233.33.
User can also click on the number of transaction and also the total offset amount.
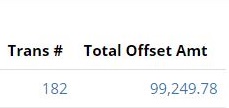
Clicking on both the number of transactions and offset amount figure will lead to this screen:
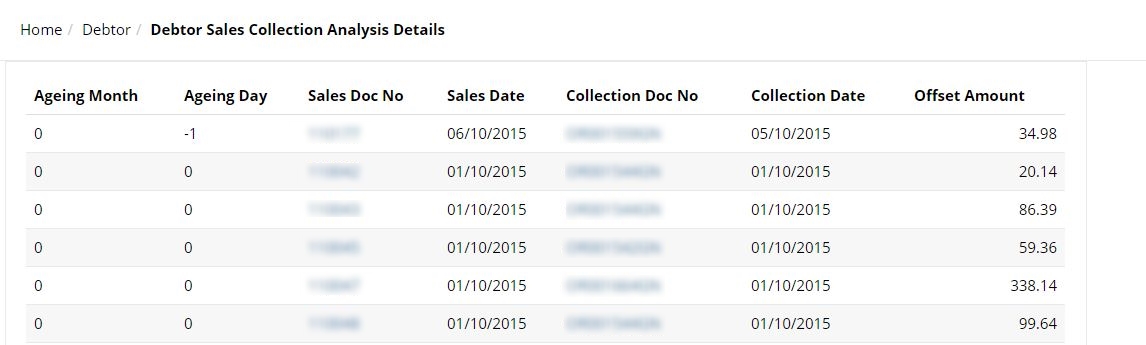 (Further explanation on this screen are described in ‘Document List’ section)
User can click on the Sales Doc No and Collection Doc No to view the details of the document.
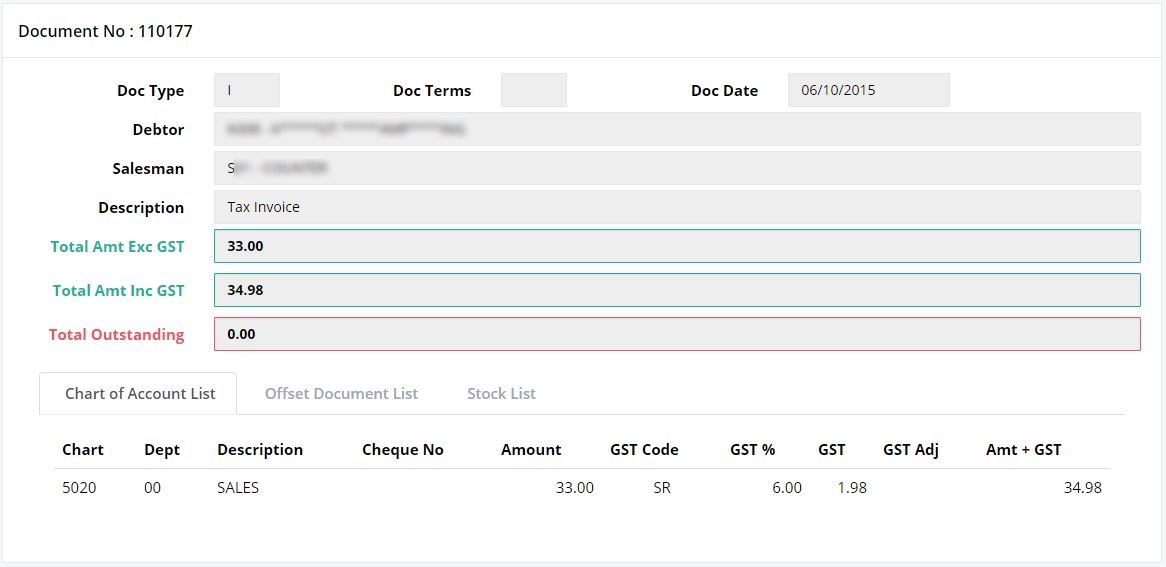
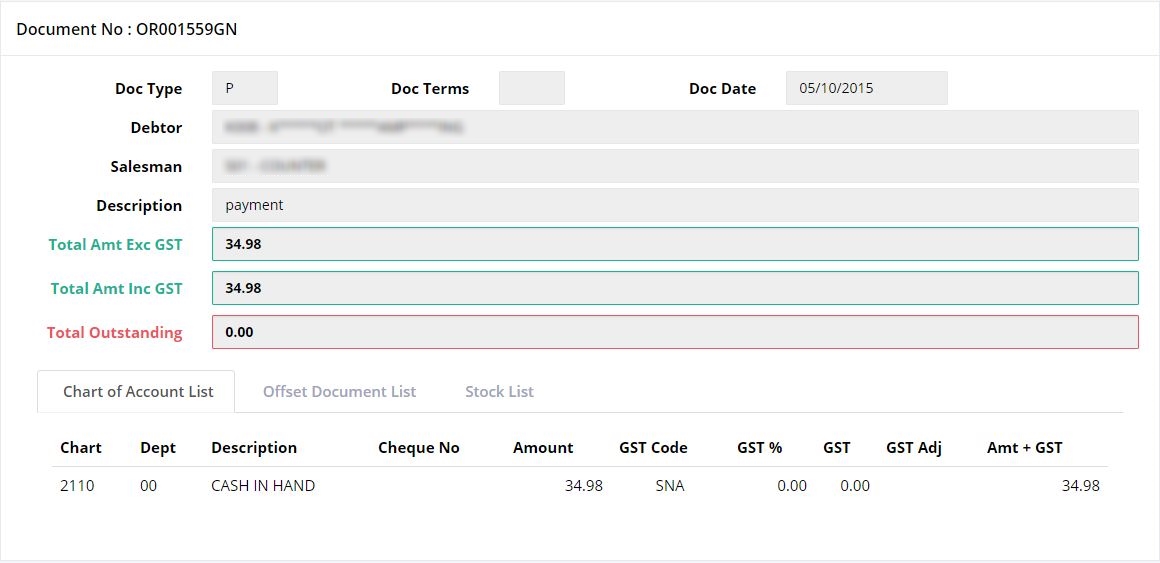 (Further explanation on this screen are described in ‘Document List’ section)